21 Linear practice
This section contains practice problems.
21.1 Linear scenarios
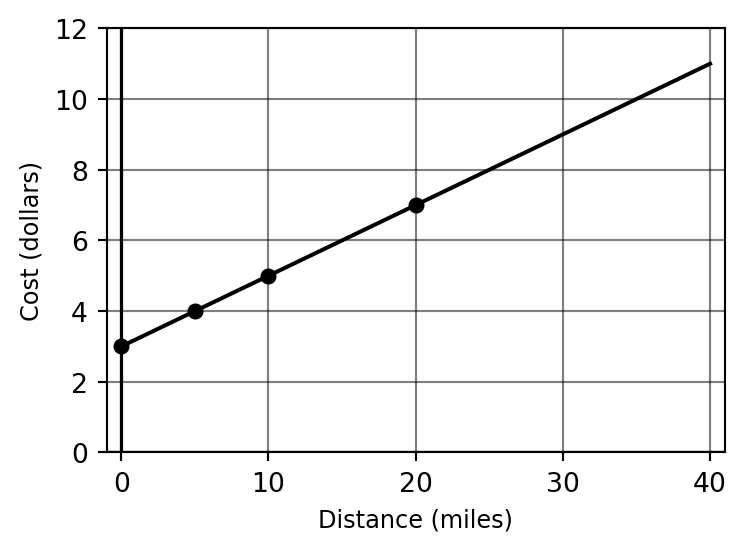
Example 21.1 (Activity: Scenario in words) The Rio Fernando Pizza Company charges customers a $3.00 delivery fee, plus $0.20 per mile, for delivering their famous green chile crust pizza. We want to describe how the cost of delivery depends on the delivery distance.
- Explain why a linear model is appropriate here.
- Construct the formula for the linear model.
- Construct a small data table.
- Sketch the plot of the linear model.
- How much would it cost to get a pizza delivered to Tres Piedras, located 31 miles from the pizza company location?
- How far away can the delivery be before the delivery cost exceeds $10?
Solutions
The cost has two parts: a fixed delivery fee ($3.00) plus a constant per-mile charge ($0.20). Because the per-mile cost is constant, the total cost increases by the same amount for each additional mile. This is a constant rate of change, so a linear model is appropriate.
Let \(x\) = delivery distance (miles), \(y\) = delivery cost (dollars). Equation: \(y = 3.00 + 0.20x\).
| \(x\) (miles) | \(y\) (dollars) |
|---|---|
| 0 | 3.00 |
| 5 | 4.00 |
| 10 | 5.00 |
| 20 | 7.00 |
\(y = 3.00 + 0.20 \cdot 31 = 3.00 + 6.20 = \$9.20\).
\(3.00 + 0.20x = 10 \Rightarrow 0.20x = 7 \Rightarrow x = 35\) miles.
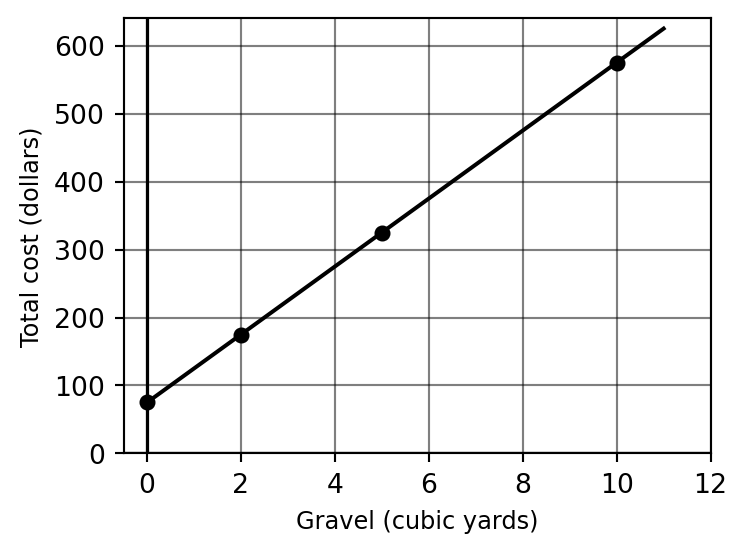
Example 21.2 (Activity: Scenario in words) The OBL Gravel Company charges $50 per cubic yard of gravel, along with a delivery fee of $75. We want to model how the cost depends on the amount of gravel being purchased.
- Explain why a linear model is appropriate here.
- Construct the formula for the linear model.
- Construct a small data table.
- Sketch the plot of the linear model.
- How much would it cost to get 20 cubic yards of gravel?
- How much gravel can be ordered before the cost exceeds $500?
Solutions
The total cost is a fixed delivery fee ($75) plus a constant per-yard charge ($50). The constant rate of change makes a linear model appropriate.
Let \(x\) = cubic yards of gravel, \(y\) = total cost (dollars). Equation: \(y = 75 + 50x\).
| \(x\) (cubic yards) | \(y\) (dollars) |
|---|---|
| 0 | 75 |
| 2 | 175 |
| 5 | 325 |
| 10 | 575 |
\(y = 75 + 50 \cdot 20 = 75 + 1000 = \$1075\).
\(75 + 50x = 500 \Rightarrow 50x = 425 \Rightarrow x = 8.5\) cubic yards.
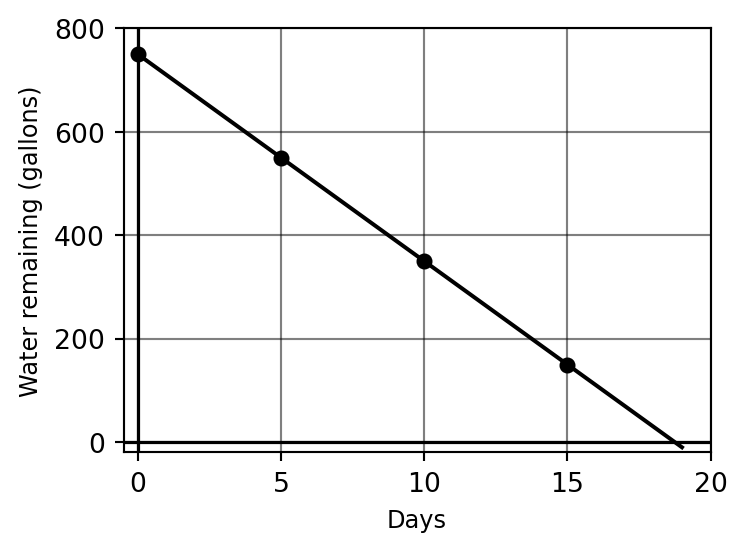
Example 21.3 (Activity: Scenario in words) At the end of the monsoon season, Elizabeth’s cistern is full with 750 gallons of water. She uses an average of 40 gallons of water per day for drinking, cooking, cleaning, and bathing. We want to model the amount of water in her cistern over time.
- Explain why a linear model is appropriate here.
- Construct the formula for the linear model.
- Construct a small data table.
- Sketch the plot of the linear model.
- How much water is left in the cistern after 2 weeks?
- How long until only 100 gallons of water remain?
Solutions
The cistern loses the same amount of water each day (40 gallons). This constant rate of change makes a linear model appropriate.
Let \(x\) = number of days, \(y\) = gallons remaining. Equation: \(y = 750 - 40x\).
| \(x\) (days) | \(y\) (gallons) |
|---|---|
| 0 | 750 |
| 5 | 550 |
| 10 | 350 |
| 15 | 150 |
Two weeks = 14 days: \(y = 750 - 40 \cdot 14 = 750 - 560 = 190\) gallons.
\(750 - 40x = 100 \Rightarrow 40x = 650 \Rightarrow x = 16.25\) days.
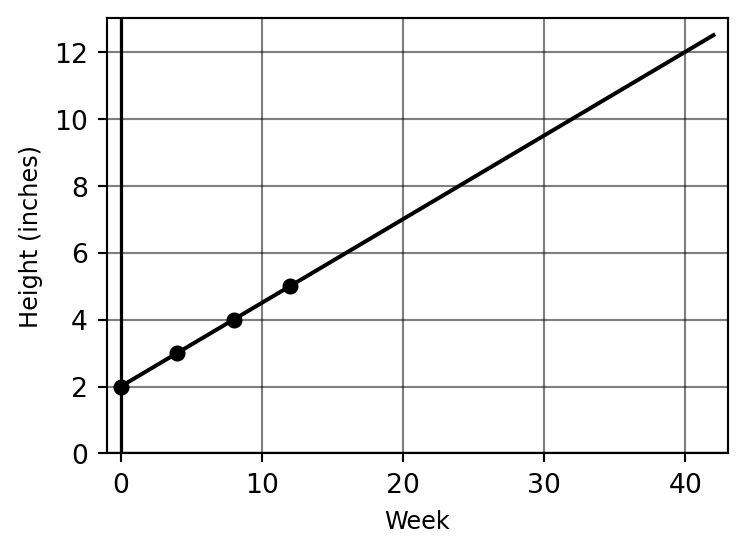
Example 21.4 (Activity: Scenario in words) Paul is saving up copies of the Taos News in a pile in his living room. Each newspaper is \(\frac{1}{4}\) inch thick. In week 4 of the semester, the pile was 3 inches high. Each week, a new paper is added to the pile. We want to model the height of the pile in terms of the week of the semester.
- Explain why a linear model is appropriate here.
- Construct the formula for the linear model.
- Construct a small data table.
- Sketch the plot of the linear model.
- How many papers were on the pile at the beginning of the semester?
- How tall will the pile be in week 14 of the semester?
- How long until the pile is a foot tall?
Solutions
The pile grows by the same amount (\(\frac{1}{4}\) inch) each week. This constant rate of change makes a linear model appropriate.
Let \(x\) = week number, \(y\) = height of pile (inches). The rate is \(m = \frac{1}{4}\). Using the point \((4, 3)\): \(3 = b + \frac{1}{4} \cdot 4 \Rightarrow b = 2\). Equation: \(y = 2 + \frac{1}{4}x\).
| \(x\) (week) | \(y\) (inches) |
|---|---|
| 0 | 2 |
| 4 | 3 |
| 8 | 4 |
| 12 | 5 |
At \(x = 0\): \(y = 2\) inches. Since each paper is \(\frac{1}{4}\) inch thick: \(2 \div \frac{1}{4} = 8\) papers.
Week 14: \(y = 2 + \frac{1}{4} \cdot 14 = 2 + 3.5 = 5.5\) inches.
\(2 + \frac{1}{4}x = 12 \Rightarrow \frac{1}{4}x = 10 \Rightarrow x = 40\) weeks.
21.2 Interpreting linear plots
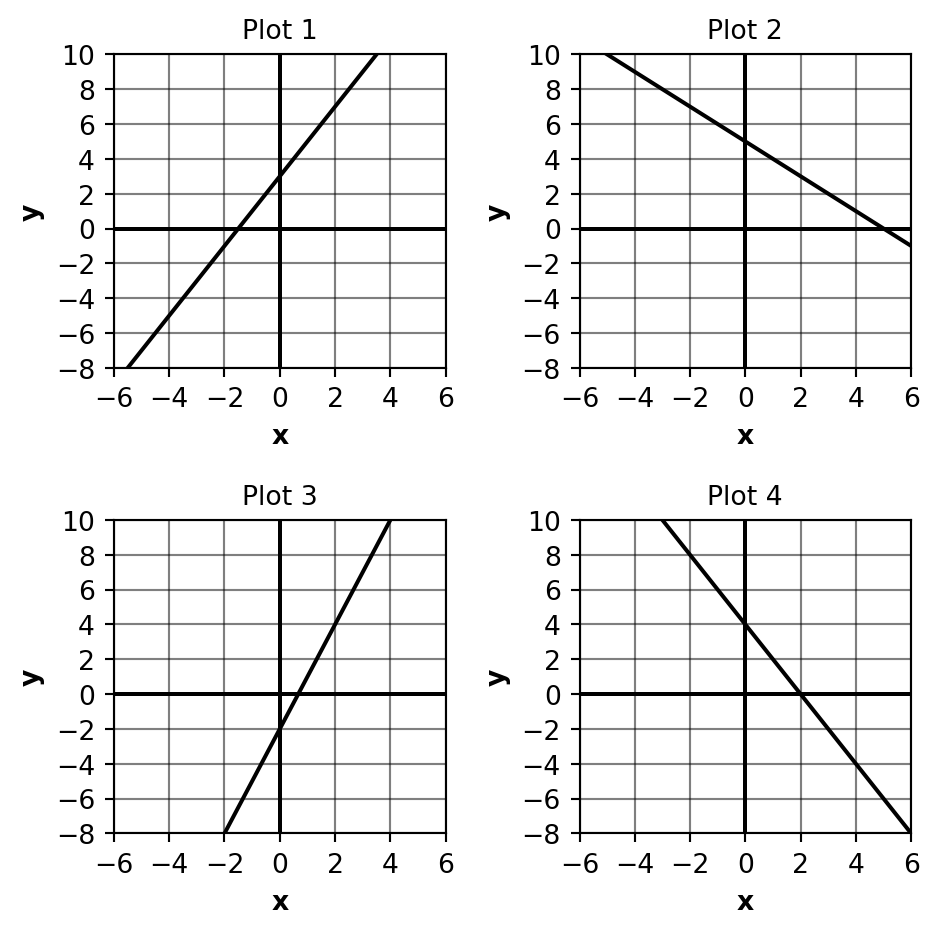
Example 21.5 (Activity: Interpreting a linear plot) For each line in the graphic below, find the base and rate, write down the equation, and determine where the line crosses the \(x\) axis.
Solutions
Plot 1 (\(y = 2x + 3\)): base \(= 3\), rate \(= 2\). \(x\)-intercept: \(0 = 2x + 3 \Rightarrow x = -\dfrac{3}{2}\).
Plot 2 (\(y = -x + 5\)): base \(= 5\), rate \(= -1\). \(x\)-intercept: \(0 = -x + 5 \Rightarrow x = 5\).
Plot 3 (\(y = 3x - 2\)): base \(= -2\), rate \(= 3\). \(x\)-intercept: \(0 = 3x - 2 \Rightarrow x = \dfrac{2}{3}\).
Plot 4 (\(y = -2x + 4\)): base \(= 4\), rate \(= -2\). \(x\)-intercept: \(0 = -2x + 4 \Rightarrow x = 2\).
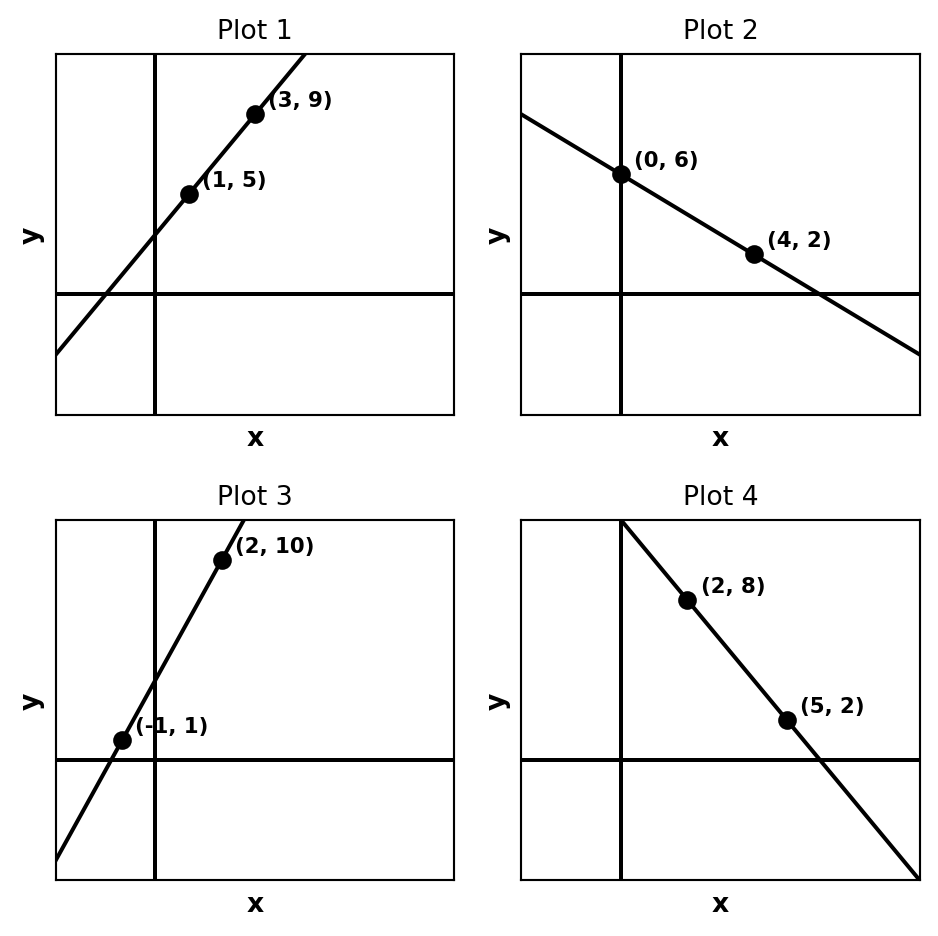
Example 21.6 (Activity: Interpreting a linear plot) For each line in the graphic below, find the base and rate, write down the equation, and determine where the line crosses the \(x\) axis.
Solutions
Plot 1 \((1,5)\) and \((3,9)\): slope \(= \dfrac{9-5}{3-1} = 2\); base: \(5 = 2(1) + b \Rightarrow b = 3\). Equation: \(y = 3 + 2x\). \(x\)-intercept: \(x = -\dfrac{3}{2}\).
Plot 2 \((0,6)\) and \((4,2)\): slope \(= \dfrac{2-6}{4-0} = -1\); base \(= 6\). Equation: \(y = 6 - x\). \(x\)-intercept: \(x = 6\).
Plot 3 \((-1,1)\) and \((2,10)\): slope \(= \dfrac{10-1}{2-(-1)} = 3\); base: \(1 = 3(-1) + b \Rightarrow b = 4\). Equation: \(y = 4 + 3x\). \(x\)-intercept: \(x = -\dfrac{4}{3}\).
Plot 4 \((2,8)\) and \((5,2)\): slope \(= \dfrac{2-8}{5-2} = -2\); base: \(8 = -2(2) + b \Rightarrow b = 12\). Equation: \(y = 12 - 2x\). \(x\)-intercept: \(x = 6\).
21.3 Interpreting linear equations
Example 21.7 (Activity: Interpreting a linear equation) Consider the line \(y = 12 - 3x\).
- What is the base? What is the rate?
- Draw a sketch of the plot of the line.
- Where does the line cross the \(x\) axis?
Solutions
Base \(b = 12\), rate \(m = -3\).
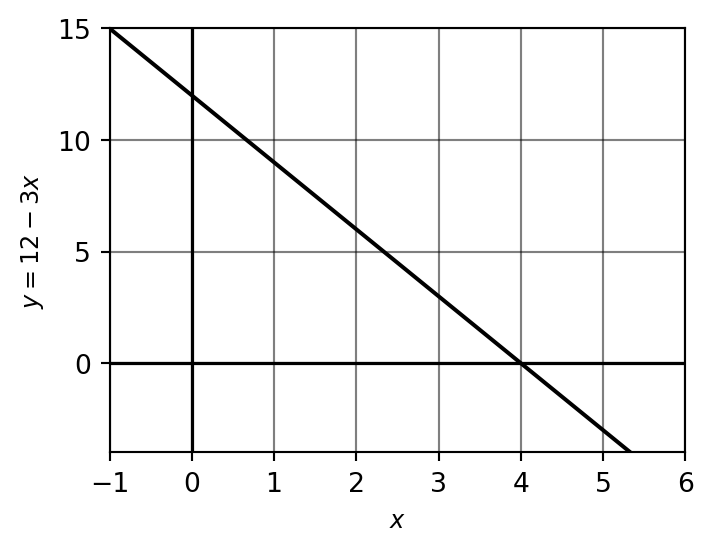
- \(0 = 12 - 3x \Rightarrow 3x = 12 \Rightarrow x = 4\). The line crosses the \(x\) axis at \((4, 0)\).
Example 21.8 (Activity: Interpreting a linear equation) Consider the line \(y = 4x + 5\).
- What is the base? What is the rate?
- Draw a sketch of the plot of the line.
- Where does the line cross the \(x\) axis?
Solutions
Base \(b = 5\), rate \(m = 4\).
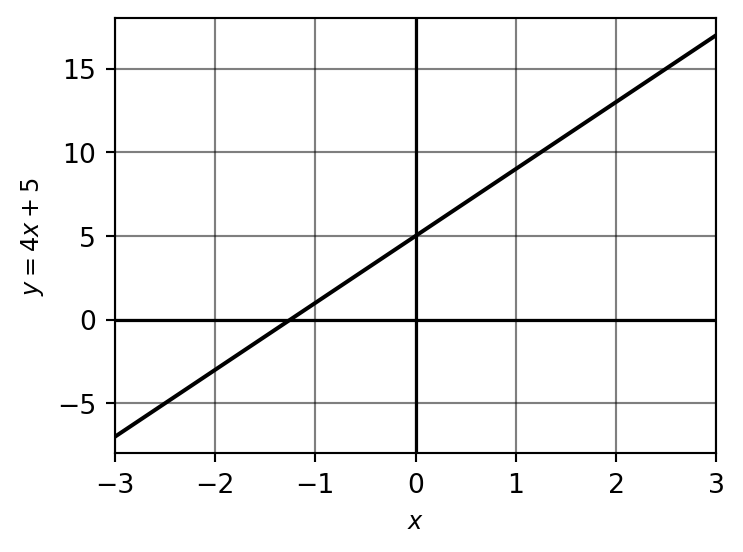
- \(0 = 4x + 5 \Rightarrow x = -\dfrac{5}{4}\). The line crosses the \(x\) axis at \(\left(-\dfrac{5}{4}, 0\right)\).
Example 21.9 (Activity: Interpreting a linear equation) Consider the line \(y = -\dfrac{1}{4}x + 6\).
- What is the base? What is the rate?
- Draw a sketch of the plot of the line.
- Where does the line cross the \(x\) axis?
Solutions
Base \(b = 6\), rate \(m = -\dfrac{1}{4}\).
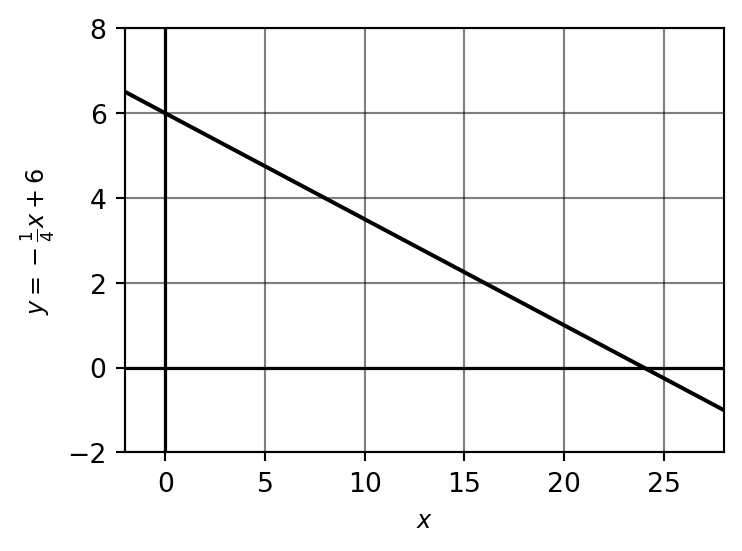
- \(0 = -\dfrac{1}{4}x + 6 \Rightarrow \dfrac{1}{4}x = 6 \Rightarrow x = 24\). The line crosses the \(x\) axis at \((24, 0)\).
Example 21.10 (Activity: Interpreting a linear equation) Consider the line \(y = \dfrac{3}{4}x - 9\).
- What is the base? What is the rate?
- Draw a sketch of the plot of the line.
- Where does the line cross the \(x\) axis?
Solutions
Base \(b = -9\), rate \(m = \dfrac{3}{4}\).
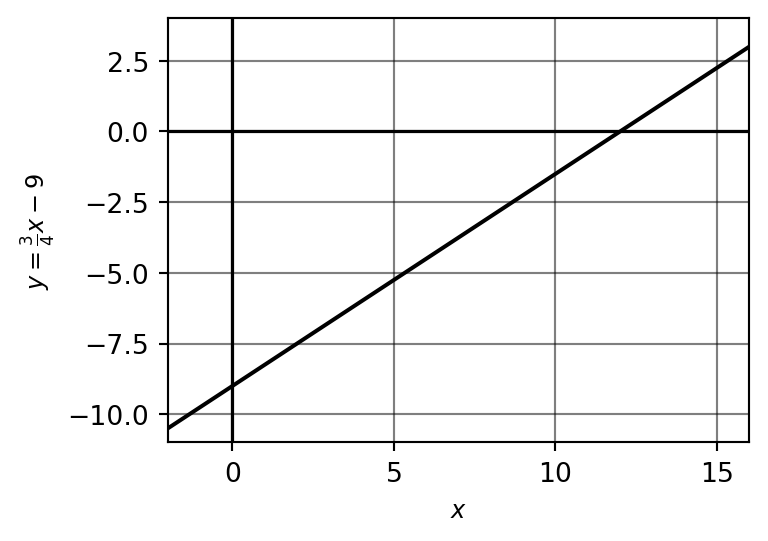
- \(0 = \dfrac{3}{4}x - 9 \Rightarrow \dfrac{3}{4}x = 9 \Rightarrow x = 12\). The line crosses the \(x\) axis at \((12, 0)\).