17 The linear model framework
A linear model is a mathematical description of a scenario in which the plotted data all lies on a straight line. Our goal for this section is to develop a systematic approach to constructing and interpreting linear models.
17.1 Generic linear model
If a scenario can be described in terms of a starting value and constant rate, then a linear model is appropriate.
The starting value is also called the base value and is usually given the letter \(b\).
The rate is usually given the letter \(m\).
We usually use the variable \(x\) to represent the input to our model, which tells us the number of rate steps. And we use the letter \(y\) to represent the output of our model, which is the amount.
In words, our model can be described by \[ \text{Resulting Amount} = (\text{Base Value}) + (\text{Rate})(\text{Number of Rate Steps}). \] In terms of the letters introduced above, the model is \[ y = b + mx. \]
Units for rate and base
It can be helpful to use units to determine what is the rate and what is the base value.
The base value has the same units as the amount \(y\) that we are modeling.
The rate has units of \(\underline\quad\) per \(\underline\quad\), where the first blank is the units of \(y\) and the second blank is the units of \(x\).
Equation for a linear model
Equations that can be written in the format \[ y = b + mx, \] where \(b\) and \(m\) are fixed numbers representing base and rate, are called linear equations or linear models.
Example 17.2 (Activity: Amie’s raffle gift card revisited) In the previous section, we also considered the situation where Amie had won the UNM Faculty-Staff raffle, earning a $100 gift card. She then went on to spend $15 from the card each week.
In our model, we are describing \(y=\) the amount left on the gift card in terms of \(x=\) the number of weeks Amie has had the card.
- What is the base value in this scenario?
- What is the rate in this scenario?
Use this information to construct the linear equation that describes this scenario.
Solutions
- Base value: \(b = 100\) dollars (the starting balance on the gift card).
- Rate: \(m = -15\) dollars per week (negative because the balance decreases).
- Linear equation: \(y = 100 - 15x\).
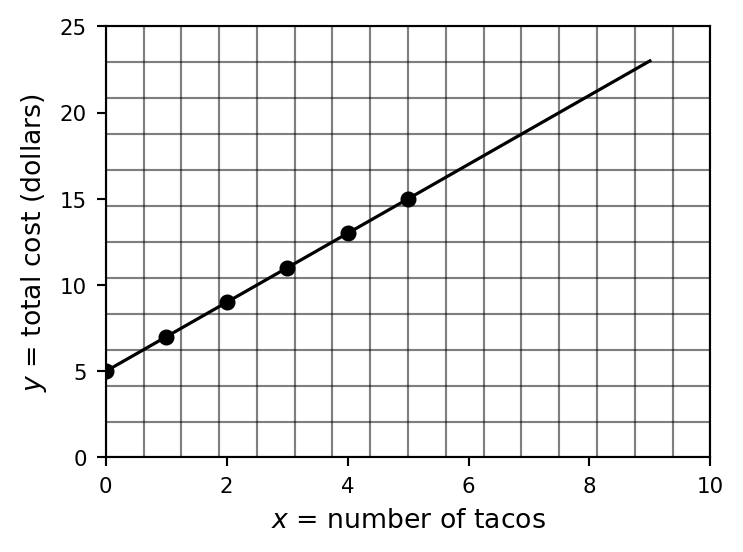
Example 17.3 (Activity: Paul’s Taco Emporium) At Paul’s Taco Emporium, customers are charged $5 for a basic plate of rice and beans, plus an additional $2 per taco.
- What is the base value? What is the rate?
- Make a table of values where \(x\) is the number of tacos and where \(y\) is the total cost of the order.
- Make a plot that shows the values in your table.
- Make an equation that gives cost in terms of the number of tacos.
- How many tacos can we get if we are willing to spend $23? Show your work!
Solutions
- Base value: \(b = 5\) dollars (the cost of a basic plate of rice and beans).
- Rate: \(m = 2\) dollars per taco.
| \(x\) (tacos) | \(y\) (total cost) |
|---|---|
| 0 | $5 |
| 1 | $7 |
| 2 | $9 |
| 3 | $11 |
| 4 | $13 |
| 5 | $15 |
- Equation: \(y = 5 + 2x\).
- For $23: \(5 + 2x = 23 \Rightarrow 2x = 18 \Rightarrow x = 9\) tacos.
Axis scales: horizontal (\(x\) = number of tacos) from 0 to 10; vertical (\(y\) = total cost) from $0 to $25.
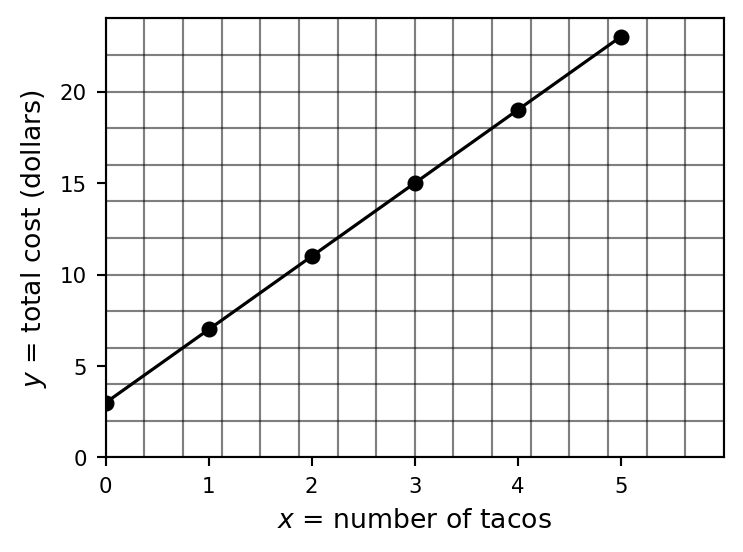
Example 17.4 (Activity: Lucas’ Taco Empire) At Lucas’ Taco Empire, customers are charged $3 for a basic plate of rice and beans, plus an additional $4 per taco.
- What is the base value? What is the rate?
- Make a table of values where \(x\) is the number of tacos and where \(y\) is the total cost of the order.
- Make a plot that shows the values in your table.
- Make an equation that gives cost in terms of the number of tacos.
- How many tacos can we get if we are willing to spend $23? Show your work!

Solutions
- Base value: \(b = 3\) dollars (the cost of a basic plate of rice and beans).
- Rate: \(m = 4\) dollars per taco.
| \(x\) (tacos) | \(y\) (total cost) |
|---|---|
| 0 | $3 |
| 1 | $7 |
| 2 | $11 |
| 3 | $15 |
| 4 | $19 |
| 5 | $23 |
- Equation: \(y = 3 + 4x\).
- For $23: \(3 + 4x = 23 \Rightarrow 4x = 20 \Rightarrow x = 5\) tacos.
Axis scales: horizontal (\(x\) = number of tacos) from 0 to 6; vertical (\(y\) = total cost) from $0 to $24.
17.2 Homework exercises
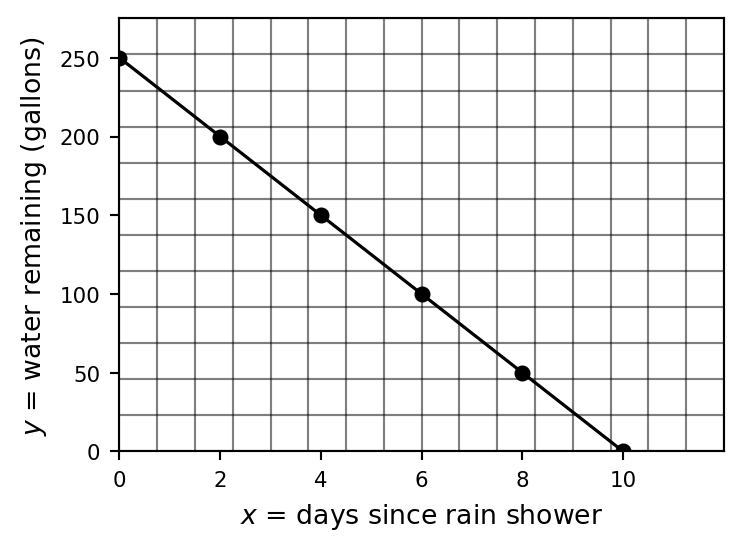
Exercise 17.1 After a summer monsoon rain shower, a cistern in Taos has been filled to 250 gallons of water. Each day, 25 gallons are used to water the garden.
Let \(x\) = the number of days since the rain shower, and let \(y\) = the amount of water remaining in the cistern (in gallons).
What is the base value in this scenario? What units does it have? What does it represent?
What is the rate in this scenario? What units does it have? What does it represent?
Write the linear equation that describes the amount of water remaining in the cistern.
After 4 days, how much water is left in the cistern? Show your work.
After how many days will exactly 50 gallons remain in the cistern? Show your work.
Make a table of values for this model, and draw the plot below.

Solutions
- Base value: \(b = 250\) gallons. This is the amount of water in the cistern right after the rain shower.
- Rate: \(m = -25\) gallons per day. It is negative because the water level decreases each day.
| \(x\) (days) | \(y\) (gallons remaining) |
|---|---|
| 0 | 250 |
| 2 | 200 |
| 4 | 150 |
| 6 | 100 |
| 8 | 50 |
| 10 | 0 |
- Equation: \(y = 250 - 25x\).
- After 4 days: \(y = 250 - 25(4) = 250 - 100 = 150\) gallons.
- For 50 gallons: \(250 - 25x = 50 \Rightarrow 25x = 200 \Rightarrow x = 8\) days.
Axis scales: horizontal (\(x\) = days since rain shower) from 0 to 12; vertical (\(y\) = water remaining) from 0 to 275.
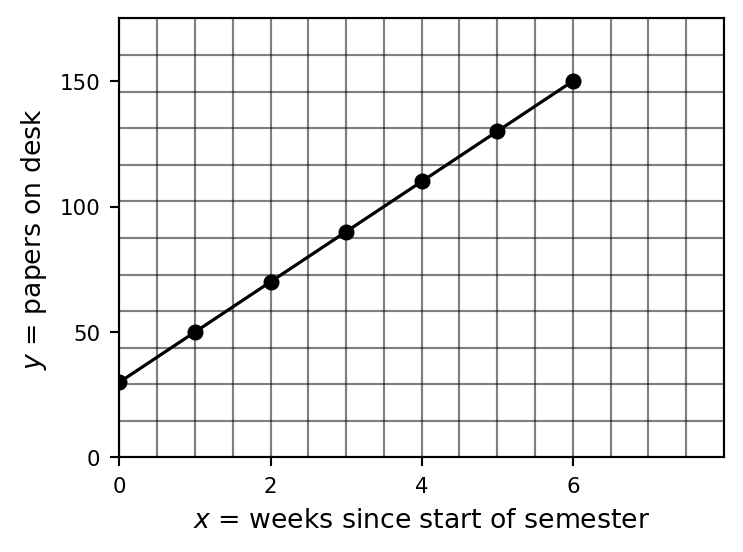
Exercise 17.2 At the start of the semester, there are 30 random papers piled in the corner of Professor Paul’s desk. Each week, an additional 20 papers accumulate on the pile.
Let \(x\) = the number of weeks since the start of the semester, and let \(y\) = the number of papers on the desk.
What is the base value in this scenario? What units does it have? What does it represent?
What is the rate in this scenario? What units does it have? What does it represent?
Write the linear equation that describes the number of papers on the desk.
How many papers are on the desk after 4 weeks? Show your work.
After how many weeks will there be 150 papers on the desk? Show your work.
Make a table of values for this model, and draw the plot below.

Solutions
- Base value: \(b = 30\) papers. This is the number of papers already on the desk at the start of the semester.
- Rate: \(m = 20\) papers per week. The pile grows by 20 papers each week.
| \(x\) (weeks) | \(y\) (papers on desk) |
|---|---|
| 0 | 30 |
| 1 | 50 |
| 2 | 70 |
| 3 | 90 |
| 4 | 110 |
| 5 | 130 |
| 6 | 150 |
- Equation: \(y = 30 + 20x\).
- After 4 weeks: \(y = 30 + 20(4) = 30 + 80 = 110\) papers.
- For 150 papers: \(30 + 20x = 150 \Rightarrow 20x = 120 \Rightarrow x = 6\) weeks.
Axis scales: horizontal (\(x\) = weeks since start of semester) from 0 to 8; vertical (\(y\) = papers on desk) from 0 to 175.
Exercise 17.3 Mark is working at a famous burrito cart on Paseo del Pueblo Sur. His daily earnings depend on how many burritos he sells. Using \(x\) to represent the number of burritos he sells and \(y\) to represent his daily earnings, we have the formula \[ y = 100 + 0.25x. \]
What number is the base in this scenario? What units does the base have? What does this number represent in the context of this scenario?
What number is the rate in this scenario? What units does the rate have? What does this number represent in the context of this scenario?
Make a table of values, and draw the plot, for this model.

Solutions
- Base: \(b = 100\) dollars per day. This is Mark’s guaranteed daily pay regardless of how many burritos he sells.
- Rate: \(m = 0.25\) dollars per burrito. He earns an additional 25 cents for each burrito sold.
| \(x\) (burritos) | \(y\) (daily earnings) |
|---|---|
| 0 | $100.00 |
| 50 | $112.50 |
| 100 | $125.00 |
| 200 | $150.00 |
Axis scales: horizontal (\(x\) = burritos sold) from 0 to 220; vertical (\(y\) = daily earnings) from $95 to $155.

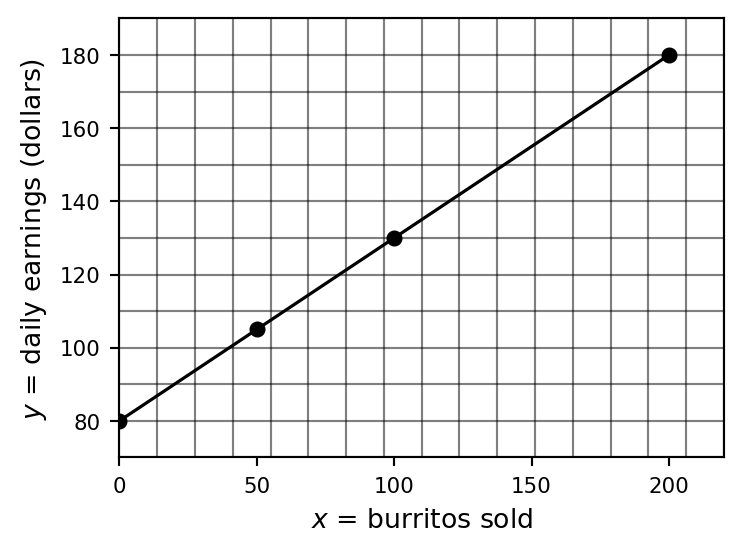
Exercise 17.4 Eric is working at a different, but also famous, burrito cart on Paseo del Pueblo Sur. His daily earnings depend on how many burritos he sells. Using \(x\) to represent the number of burritos he sells and \(y\) to represent his daily earnings, we have the formula \[ y = 80 + 0.50x. \]
What number is the base in this scenario? What units does the base have? What does this number represent in the context of this scenario?
What number is the rate in this scenario? What units does the rate have? What does this number represent in the context of this scenario?
Make a table of values, and draw the plot, for this model.

Solutions
- Base: \(b = 80\) dollars per day. This is Eric’s guaranteed daily pay regardless of how many burritos he sells.
- Rate: \(m = 0.50\) dollars per burrito. He earns an additional 50 cents for each burrito sold.
| \(x\) (burritos) | \(y\) (daily earnings) |
|---|---|
| 0 | $80.00 |
| 50 | $105.00 |
| 100 | $130.00 |
| 200 | $180.00 |
Axis scales: horizontal (\(x\) = burritos sold) from 0 to 220; vertical (\(y\) = daily earnings) from $70 to $190.