15 Practice with data tables and plots
In this section, we have two goals:
- First, we want to be more systematic about setting the horizontal and vertical scales for our plots.
- Second, we practice using data tables and plots to describe various scenarios.
15.1 Choosing horizontal and vertical scales
Most of the graph paper pieces we have been using are 20 squares wide and 16 squares tall. How can we choose the horizontal and vertical scale to best use this space?
Example 15.1 (Activity: choosing plot scales) Sugar Paws, a dog who lives in El Prado, starts 5 meters away from her owners. She starts running away from her owners at 2 meters per second. We use the variables
- \(x\) is the number of seconds
- \(y\) is the distance from dog to owners
to describe the situation over the course of 10 seconds.
Table of Values
Create a table of values for this scenario.
| \(x=\) time (seconds) | \(y=\) distance (meters) |
|---|---|
| 0 | |
| 1 | |
| 2 | |
| 3 | |
| \(\vdots\) | |
| 10 |
Horizontal Scale
We want \(x\) to range from \(\underline\qquad\) to \(\underline\qquad\).
In order to use as close to 20 boxes as best as possible, we choose a scale so that \[ \underline\qquad \text{second(s)} = \underline\qquad \text{box(es)}. \]
Vertical Scale
We want \(y\) to range from \(\underline\qquad\) to \(\underline\qquad\).
For convenience, we want to show \(y=0\) on the plot.
In order to use as close to 16 boxes as best as possible, we choose a scale so that \[ \underline\qquad \text{meter(s)} = \underline\qquad \text{box(es)}. \]
Plot
Use the scales you determined above to create a plot for this scenario. Fill in additional data points as well.
Solutions
Let \(x\) = time (seconds) and \(y\) = distance from owners (meters).
Completed table:
| \(x\) (seconds) | \(y\) (meters) |
|---|---|
| 0 | 5 |
| 1 | 7 |
| 2 | 9 |
| 3 | 11 |
| 4 | 13 |
| 5 | 15 |
| 6 | 17 |
| 7 | 19 |
| 8 | 21 |
| 9 | 23 |
| 10 | 25 |
One reasonable scale choice:
- Horizontal: \(x\) from 0 to 10; 2 boxes per second (20 boxes for 10 seconds).
- Vertical: \(y\) from 0 to 32; 2 meters per box (16 boxes × 2 = 32 meters, which covers \(y=25\)).
Example 15.2 (Activity: raffle gift card) Amie wins the UNM Faculty-Staff raffle, earning a $100 gift card to a fancy chocolate shop near the plaza. Each week, she spends $15 on a fancy mocha and croissant. Describe this scenario using the variables
- \(x\) is the number of weeks
- \(y\) is the balance on her gift card
to describe the scenario for 5 weeks.
Table of Values
Create a table of values for this scenario.
Horizontal Scale We want \(x\) to range from \(\underline\qquad\) to \(\underline\qquad\).
In order to use as close to 20 boxes as best as possible, we choose a scale so that \[ \underline\qquad \text{week(s)} = \underline\qquad \text{box(es)}. \]
Vertical Scale
We want \(y\) to range from \(\underline\qquad\) to \(\underline\qquad\).
For convenience, we want to show \(y=0\) on the plot.
In order to use as close to 16 boxes as best as possible, we choose a scale so that \[ \underline\qquad \text{dollar(s)} = \underline\qquad \text{box(es)}. \]
Plot
Use the scale you have chosen above to create a plot for this scenario.

Solutions
Let \(x\) = weeks and \(y\) = balance on gift card (dollars).
Completed table:
| \(x\) (weeks) | \(y\) (dollars) |
|---|---|
| 0 | 100 |
| 1 | 85 |
| 2 | 70 |
| 3 | 55 |
| 4 | 40 |
| 5 | 25 |
One reasonable scale choice:
- Horizontal: \(x\) from 0 to 5; 4 boxes per week (20 boxes for 5 weeks).
- Vertical: \(y\) from 0 to 112; $7 per box (16 boxes × $7 = $112, which covers the full range from $25 to $100).
15.2 More modeling scenarios
We now consider more modeling scenarios. For each scenario below, complete the following tasks.
- Identify the key quantities of the scenario, and assign variables to each.
- Make a table of values showing pairs of related values.
- Construct a plot, based on your table of values.
Example 15.3 (Activity: driving to Denver) Mary is driving from Taos to Denver, averaging a speed of 60 miles per hour. The total distance for the trip is 360 miles.
Your task is to describe how the time that Mary has driven relates to the distance remaining. (For example, after 1 hour, Mary still has 300 miles left to travel.)

Solutions
Let \(x\) = hours driven and \(y\) = distance remaining (miles).
| \(x\) (hours) | \(y\) (miles remaining) |
|---|---|
| 0 | 360 |
| 1 | 300 |
| 2 | 240 |
| 3 | 180 |
| 4 | 120 |
| 5 | 60 |
| 6 | 0 |
One reasonable scale choice: Horizontal (\(x\)) from 0 to 6, about 3 boxes per hour (18 of 20 boxes used). Vertical (\(y\)) from 0 to 400, 25 miles per box (16 × 25 = 400).
Example 15.4 (Activity: filling the tank) At Fast Route Discount Gas, unleaded fuel is currently priced at $2.85 per gallon. Randi is filling her tank, which holds a total of 15 gallons.
Your task is to relate the amount of gas Randi puts in her car to the cost of the gas. (For example, two gallons of gas costs $5.70.)

Solutions
Let \(x\) = gallons pumped and \(y\) = cost (dollars).
| \(x\) (gallons) | \(y\) (dollars) |
|---|---|
| 0 | 0 |
| 1 | 2.85 |
| 2 | 5.70 |
| 3 | 8.55 |
| 5 | 14.25 |
| 10 | 28.50 |
| 15 | 42.75 |
One reasonable scale choice: Horizontal (\(x\)) from 0 to 20, 1 box per gallon (15 of 20 boxes used). Vertical (\(y\)) from 0 to 48, $3 per box (16 × $3 = $48, which covers $42.75).
Example 15.5 (Activity: coffee card) Mandy is given a gift card to the Taos Bean Company for her birthday. The card comes with $50 on it. Each day, she stops by and spends $3.75 on a coffee drink.
Your task is to relate the number of days that has gone by to the balance left on her card. (For example, after 1 day, the balance is $46.25.)

Solutions
Let \(x\) = days and \(y\) = balance on the gift card (dollars).
| \(x\) (days) | \(y\) (dollars) |
|---|---|
| 0 | 50.00 |
| 1 | 46.25 |
| 2 | 42.50 |
| 3 | 38.75 |
| 4 | 35.00 |
| 5 | 31.25 |
| 10 | 12.50 |
| 13 | 1.25 |
The card runs out after \(x = 50 \div 3.75 \approx 13.3\) days.
One reasonable scale choice: Horizontal (\(x\)) from 0 to 14, about 1.4 boxes per day. Vertical (\(y\)) from 0 to 56, $3.50 per box (16 × $3.50 = $56, which covers $50).
15.3 Homework exercises
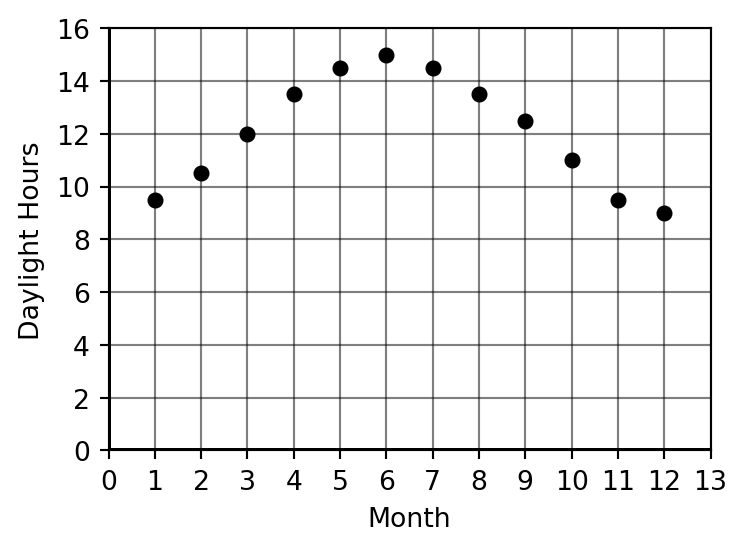
Exercise 15.1 The following table shows daylight hours in Taos, NM in terms of the month. Plot the data on the Cartesian plane below.
| Month | Daylight Hours |
|---|---|
| 1 | 9.5 |
| 2 | 10.5 |
| 3 | 12.0 |
| 4 | 13.5 |
| 5 | 14.5 |
| 6 | 15.0 |
| 7 | 14.5 |
| 8 | 13.5 |
| 9 | 12.5 |
| 10 | 11.0 |
| 11 | 9.5 |
| 12 | 9.0 |
Solutions
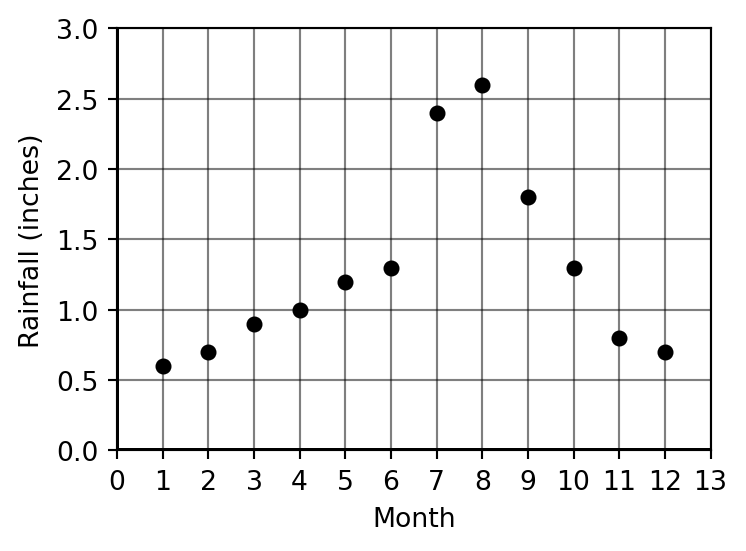
Exercise 15.2 The following table shows average monthly rainfall in Taos, NM.
| Month | Rainfall (inches) |
|---|---|
| 1 | 0.6 |
| 2 | 0.7 |
| 3 | 0.9 |
| 4 | 1.0 |
| 5 | 1.2 |
| 6 | 1.3 |
| 7 | 2.4 |
| 8 | 2.6 |
| 9 | 1.8 |
| 10 | 1.3 |
| 11 | 0.8 |
| 12 | 0.7 |
Plot the data from the table in the coordinate grid below.
Solutions
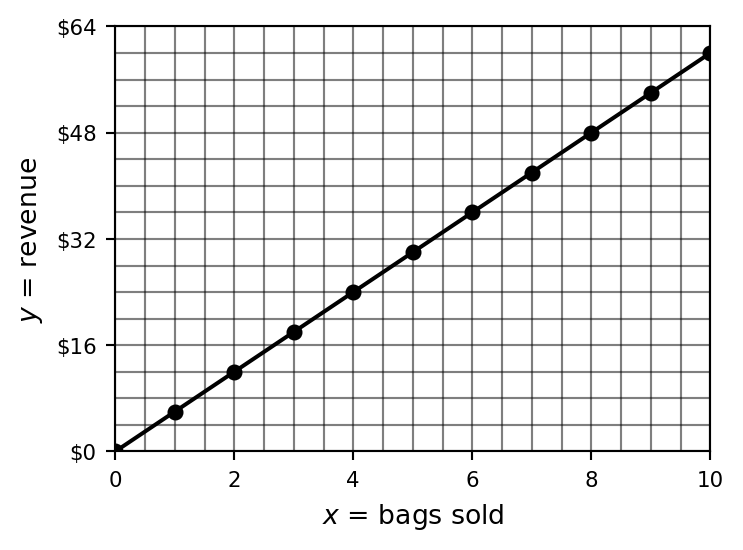
Exercise 15.3 Paco has a side hustle selling cookies at the Taos Farmers Market. He charges $6 for a bag of three cookies.
Make a table of values that relates the number of cookies sold (\(x\)) and the revenue that Paco generates (\(y\)). Your table should include the possibility that Paco can sell 10 bags of cookies in a single day.
Make a plot of the data points from your table and connect the points with a line.

Solutions
Let \(x\) = bags sold and \(y\) = revenue (dollars).
| \(x\) (bags) | \(y\) (revenue) |
|---|---|
| 0 | $0 |
| 1 | $6 |
| 2 | $12 |
| 3 | $18 |
| 4 | $24 |
| 5 | $30 |
| 6 | $36 |
| 7 | $42 |
| 8 | $48 |
| 9 | $54 |
| 10 | $60 |
Scale: \(x\) from 0 to 10, 2 boxes per bag. \(y\) from 0 to 64, $4 per box (16 × $4 = $64).
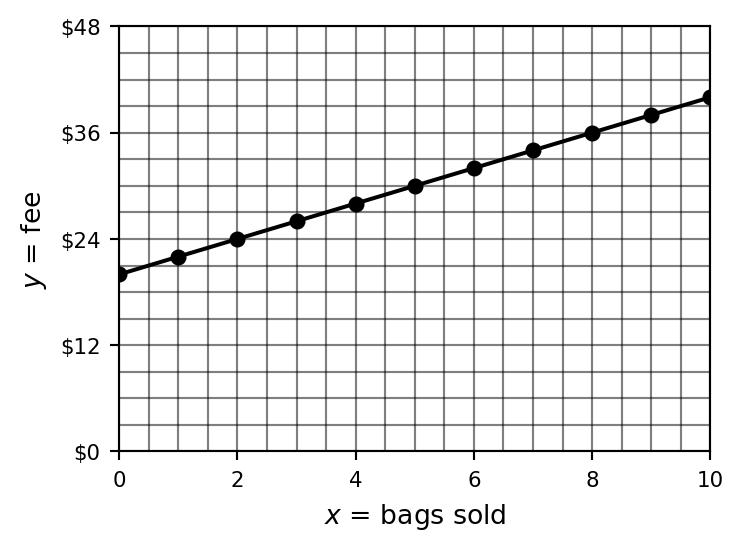
Exercise 15.4 The Taos Farmer’s Market charges Paco for the priviledge of selling at the market. They charge him a $20 entry fee, and also charge him $2 for every bag of cookies that he sells.
Make a table of values that relates the number of cookies he sells (\(x\)) to the fee that Paco is charged (\(y\)).
Make a plot of your data points and then construct a line.

Solutions
Let \(x\) = bags sold and \(y\) = market fee (dollars).
| \(x\) (bags) | \(y\) (fee) |
|---|---|
| 0 | $20 |
| 1 | $22 |
| 2 | $24 |
| 3 | $26 |
| 4 | $28 |
| 5 | $30 |
| 6 | $32 |
| 7 | $34 |
| 8 | $36 |
| 9 | $38 |
| 10 | $40 |
Scale: \(x\) from 0 to 10, 2 boxes per bag. \(y\) from 0 to 48, $3 per box (16 × $3 = $48).