18 Linear model analysis
In this section we practice analyzing linear equations.
18.1 Interpreting linear formulas
In the previous scenarios we had to construct the formula. Now we consider the reverse problem: suppose we are given the formula and asked to interpret it.
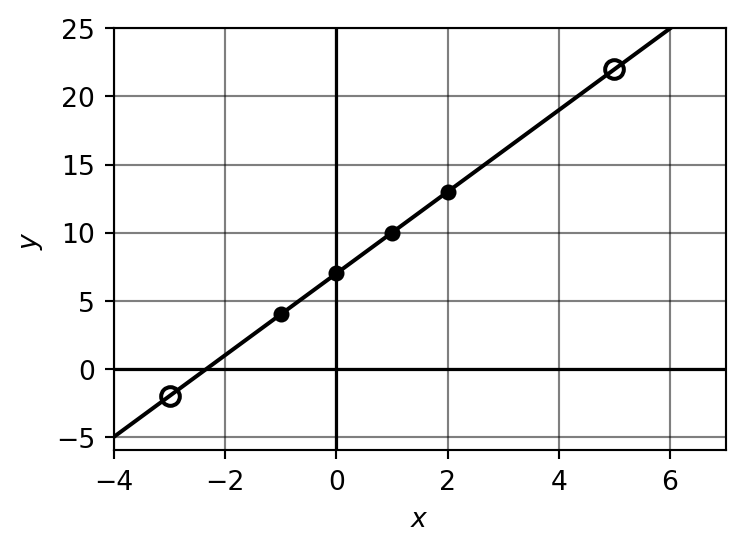
Example 18.1 (Activity: Interpreting \(y = 7 + 3x\)) Consider the linear relation \(y = 7 + 3x\).
Make a table of values.
Sketch the plot, without graph paper.
Suppose \(y = 22\). What is \(x\)? Show your work, and also indicate this on the graph.
Suppose \(x = -3\). What is \(y\)? Show your work, and also indicate this on the graph.
Solutions
| \(x\) | \(y = 7 + 3x\) |
|---|---|
| -1 | 4 |
| 0 | 7 |
| 1 | 10 |
| 2 | 13 |
- \(y = 22\): \(7 + 3x = 22 \Rightarrow 3x = 15 \Rightarrow x = 5\).
- \(x = -3\): \(y = 7 + 3(-3) = 7 - 9 = -2\).
Circles mark the table values; hollow circles mark the two answer points \((5, 22)\) and \((-3, -2)\).
Example 18.2 (Activity: Interpreting \(y = -3 + 4x\)) Consider the linear relation \(y = -3 + 4x\).
Make a table of values.
Sketch the plot, without graph paper.
Suppose \(y = 22\). What is \(x\)? Show your work, and also indicate this on the graph.
Suppose \(x = -3\). What is \(y\)? Show your work, and also indicate this on the graph.
Solutions
| \(x\) | \(y = -3 + 4x\) |
|---|---|
| -1 | -7 |
| 0 | -3 |
| 1 | 1 |
| 2 | 5 |
- \(y = 22\): \(-3 + 4x = 22 \Rightarrow 4x = 25 \Rightarrow x = 6.25\).
- \(x = -3\): \(y = -3 + 4(-3) = -3 - 12 = -15\).
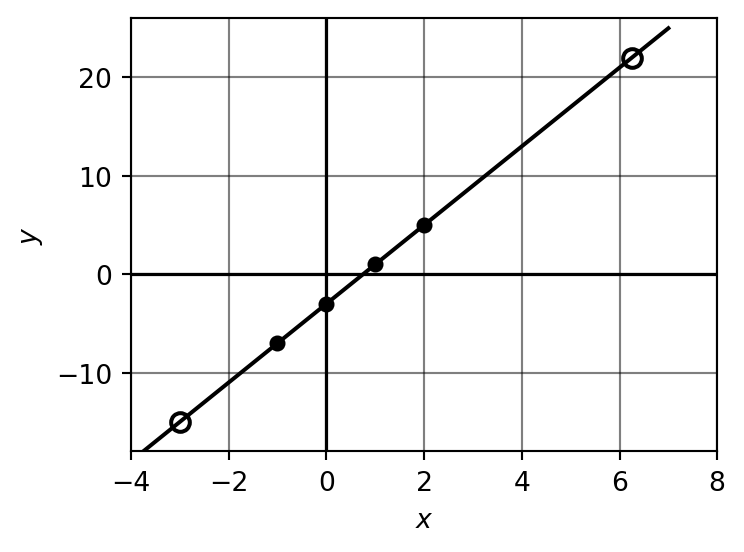
Circles mark the table values; hollow circles mark the two answer points \((6.25, 22)\) and \((-3, -15)\).
Example 18.3 (Activity: Interpreting \(y = 6 - 2x\)) Consider the linear relation \(y = 6 - 2x\).
Make a table of values.
Sketch the plot, without graph paper.
Suppose \(y = 22\). What is \(x\)? Show your work, and also indicate this on the graph.
Suppose \(x = -3\). What is \(y\)? Show your work, and also indicate this on the graph.
Solutions
| \(x\) | \(y = 6 - 2x\) |
|---|---|
| -1 | 8 |
| 0 | 6 |
| 1 | 4 |
| 2 | 2 |
- \(y = 22\): \(6 - 2x = 22 \Rightarrow -2x = 16 \Rightarrow x = -8\).
- \(x = -3\): \(y = 6 - 2(-3) = 6 + 6 = 12\).
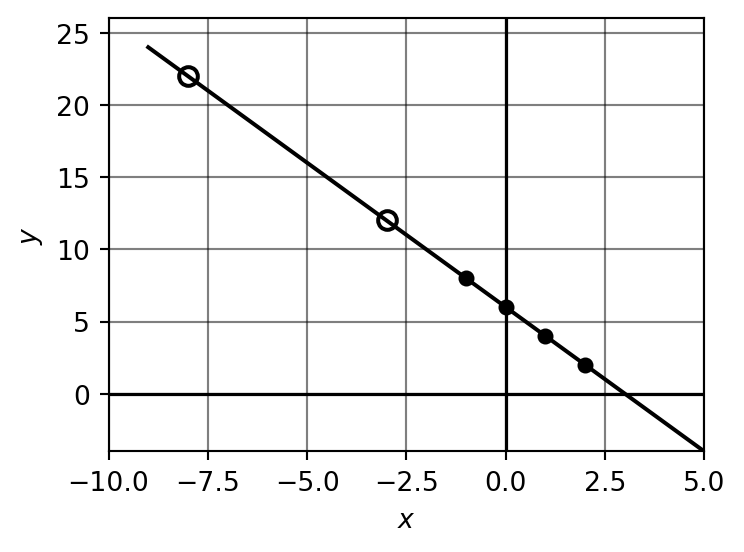
Circles mark the table values; hollow circles mark the two answer points \((-8, 22)\) and \((-3, 12)\).
Example 18.4 (Activity: Interpreting \(y = 6 + x\)) Consider the linear relation \(y = 6 + x\).
Make a table of values.
Sketch the plot, without graph paper.
Suppose \(y = 22\). What is \(x\)? Show your work, and also indicate this on the graph.
Suppose \(x = -3\). What is \(y\)? Show your work, and also indicate this on the graph.
Solutions
| \(x\) | \(y = 6 + x\) |
|---|---|
| -1 | 5 |
| 0 | 6 |
| 1 | 7 |
| 2 | 8 |
- \(y = 22\): \(6 + x = 22 \Rightarrow x = 16\).
- \(x = -3\): \(y = 6 + (-3) = 3\).
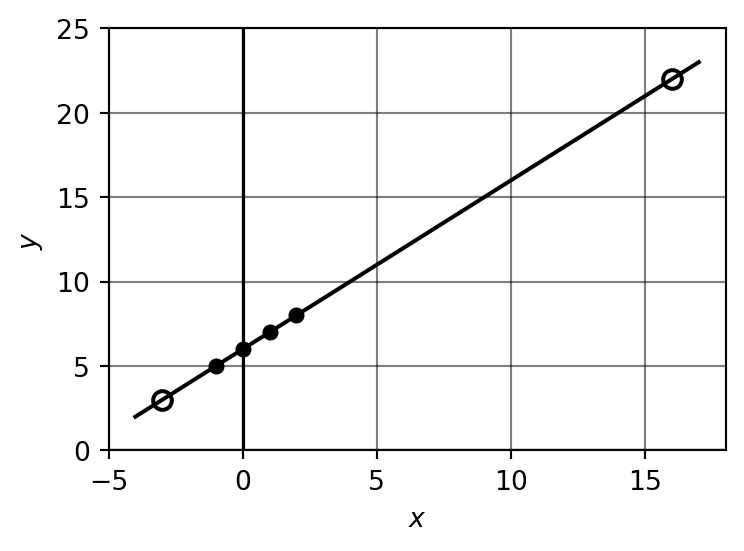
Circles mark the table values; hollow circles mark the two answer points \((16, 22)\) and \((-3, 3)\).
18.2 Challenge: determining the rate from data
Sometimes the scenario is not described in a way that clearly identifies the base and the rate. The next activity explores this situation.
Example 18.5 (Activity: Jim’s parking lot) Jim is running a private parking lot near the Alamosa Airport. He charges $12 for 2 days. He charges $18 for 4 days. We are going to assume that we have a linear relation between days and price.
- Make a graph of the data. Extend your graph to a straight line.
- Use your graph to figure out the base value for the linear relation.
- Use your graph to figure out the rate for the linear relation.
- What is the formula for cost in terms of number of days?
- How much does it cost to park at Jim’s lot for 7 days?
- How long can you park at Jim’s lot before the cost exceeds $50?
Solutions
- Rate: \(\dfrac{18 - 12}{4 - 2} = \dfrac{6}{2} = 3\) dollars per day.
- Base value: using the point \((2, 12)\): \(12 = b + 3 \cdot 2 \Rightarrow b = 6\) dollars.
- Formula: \(y = 6 + 3x\).
- For 7 days: \(y = 6 + 3(7) = 27\) dollars.
- For $50: \(6 + 3x = 50 \Rightarrow 3x = 44 \Rightarrow x \approx 14.7\) days.
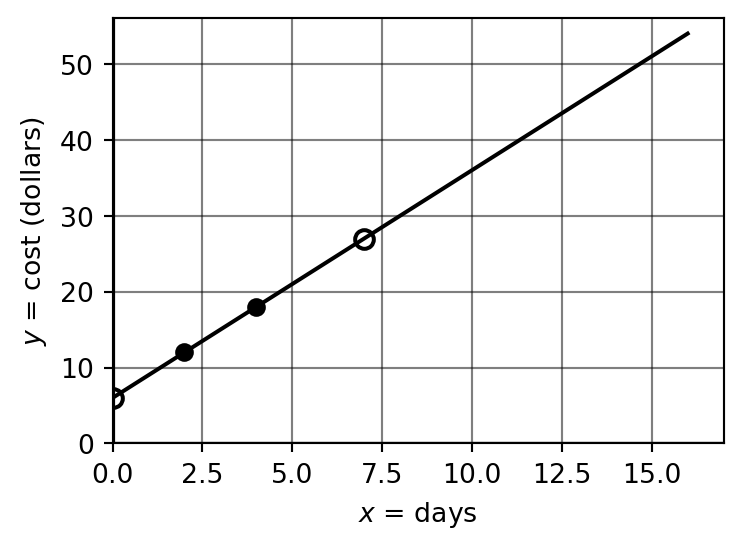
Circles mark the two given data points; hollow circles mark the base value \((0, 6)\) and the 7-day cost \((7, 27)\).
18.3 Homework exercises
Exercise 18.1 Consider the linear model \(y = 2x + 6\).
Make a small table of values.
Sketch the plot, indicating the key features.
Find \(x\) when \(y = 16\). Show your work.
Find \(y\) when \(x = -2\). Show your work.
Solutions
| \(x\) | \(y\) |
|---|---|
| 0 | 6 |
| 1 | 8 |
| 2 | 10 |
| 3 | 12 |
- \(y = 16\): \(2x + 6 = 16 \Rightarrow 2x = 10 \Rightarrow x = 5\).
- \(x = -2\): \(y = 2(-2) + 6 = 2\).
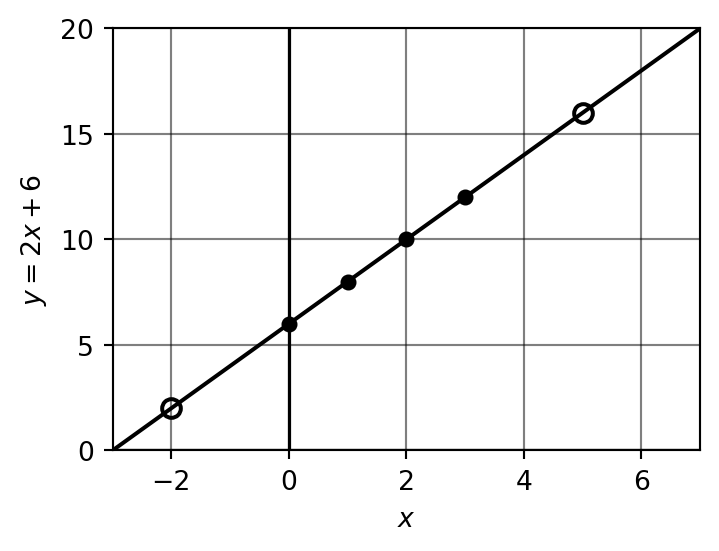
Filled circles mark the table values; hollow circles mark the answer points \((5, 16)\) and \((-2, 2)\).
Exercise 18.2 Consider the linear model \(y = 3x - 2\).
Make a small table of values.
Sketch the plot, indicating the key features.
Find \(x\) when \(y = 16\). Show your work.
Find \(y\) when \(x = -2\). Show your work.
Solutions
| \(x\) | \(y\) |
|---|---|
| 0 | -2 |
| 1 | 1 |
| 2 | 4 |
| 3 | 7 |
- \(y = 16\): \(3x - 2 = 16 \Rightarrow 3x = 18 \Rightarrow x = 6\).
- \(x = -2\): \(y = 3(-2) - 2 = -8\).
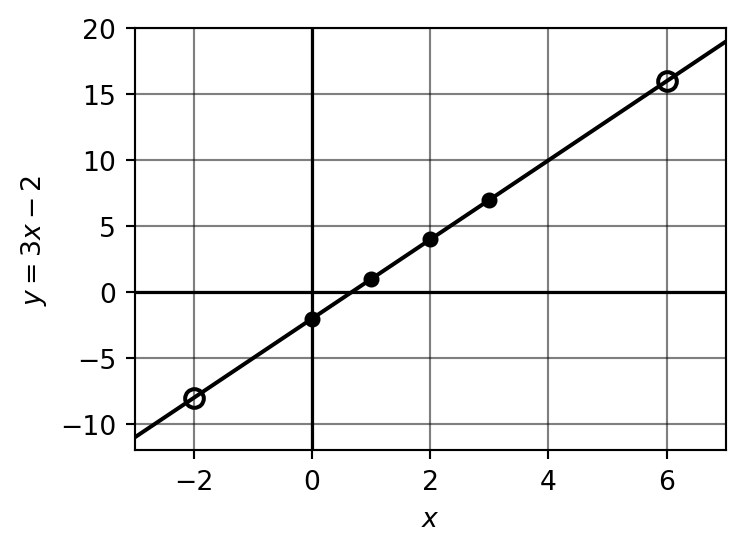
Filled circles mark the table values; hollow circles mark the answer points \((6, 16)\) and \((-2, -8)\).
Exercise 18.3 Consider the linear model \(y = 32 - 4x\).
Make a small table of values.
Sketch the plot, indicating the key features.
Find \(x\) when \(y = 20\). Show your work.
Find \(y\) when \(x = -2\). Show your work.
Solutions
| \(x\) | \(y\) |
|---|---|
| 0 | 32 |
| 2 | 24 |
| 4 | 16 |
| 6 | 8 |
- \(y = 20\): \(32 - 4x = 20 \Rightarrow 4x = 12 \Rightarrow x = 3\).
- \(x = -2\): \(y = 32 - 4(-2) = 40\).
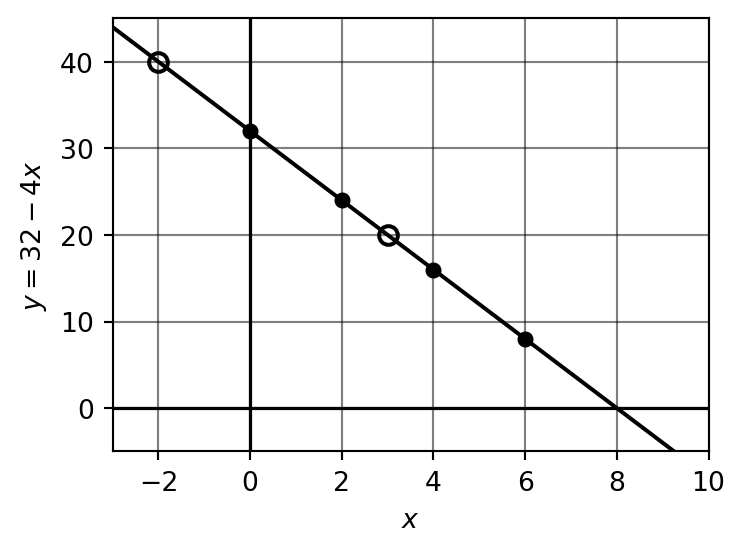
Filled circles mark the table values; hollow circles mark the answer points \((3, 20)\) and \((-2, 40)\).
Exercise 18.4 Consider the linear model \(y = 11 + x\).
Make a small table of values.
Sketch the plot, indicating the key features.
Find \(x\) when \(y = 15\). Show your work.
Find \(y\) when \(x = -2\). Show your work.
Solutions
| \(x\) | \(y\) |
|---|---|
| 0 | 11 |
| 1 | 12 |
| 2 | 13 |
| 3 | 14 |
- \(y = 15\): \(11 + x = 15 \Rightarrow x = 4\).
- \(x = -2\): \(y = 11 + (-2) = 9\).
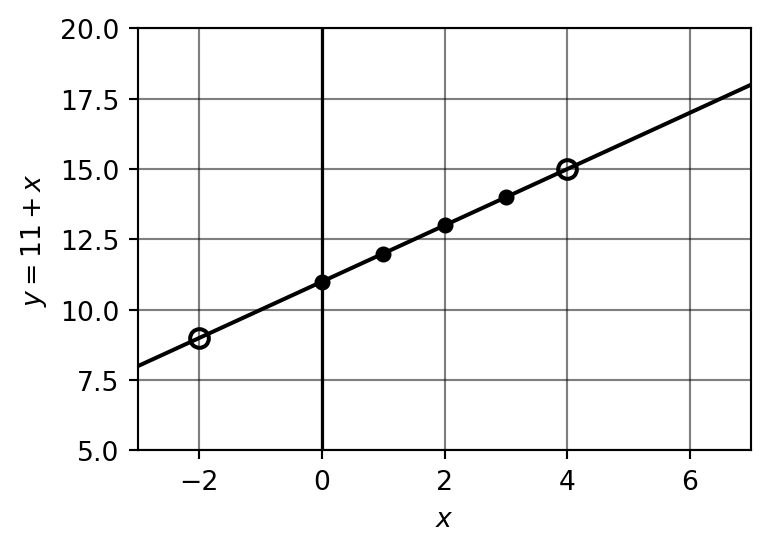
Filled circles mark the table values; hollow circles mark the answer points \((4, 15)\) and \((-2, 9)\).
Exercise 18.5 Lucas is planning to open a competing parking lot at the Alamosa Airport. He will charge $16 for 2 days and will charge $24 for 6 days. We are going to assume that Lucas uses a linear relation between days and price.
- Make a graph of the data. Extend your graph to a straight line.
- Use your graph to figure out the base value for the linear relation.
- Use your graph to figure out the rate for the linear relation.
- What is the formula for cost in terms of number of days?
- How much does it cost to park at Lucas’ lot for 7 days?
- How long can you park at Lucas’ lot before the cost exceeds $50?
Solutions
- Rate: \(\dfrac{24 - 16}{6 - 2} = \dfrac{8}{4} = 2\) dollars per day.
- Base value: using the point \((2, 16)\): \(16 = b + 2 \cdot 2 \Rightarrow b = 12\) dollars.
- Formula: \(y = 12 + 2x\).
- For 7 days: \(y = 12 + 2(7) = 26\) dollars.
- For $50: \(12 + 2x = 50 \Rightarrow 2x = 38 \Rightarrow x = 19\) days.
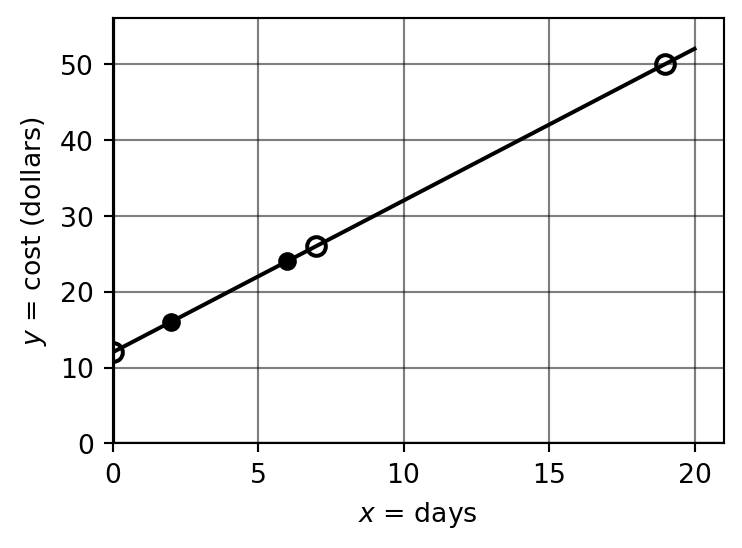
Circles mark the two given data points; hollow circles mark the base value \((0, 12)\), the 7-day cost \((7, 26)\), and the $50 threshold \((19, 50)\).