
16 Linear vs nonlinear relations
In our previous exploration of data tables and plots, there were many examples where the plotted points were along a straight line.
Take a moment right now and look over the previous sections: which scenarios had data points in a straight line?
Our task in this section is to start to systematically identify what types of scenarios have straight line plots.
To address this issue, we consider four different scenarios. For each scenario, your task is to create a table of values and then to create the plot. Two of the scenarios will give us straight line plots, and two of the scenarios will not give us straight line plots. After we have analyzed the scenarios, we will discuss a general rule for determining what type of scenarios can be described with straight line plots.
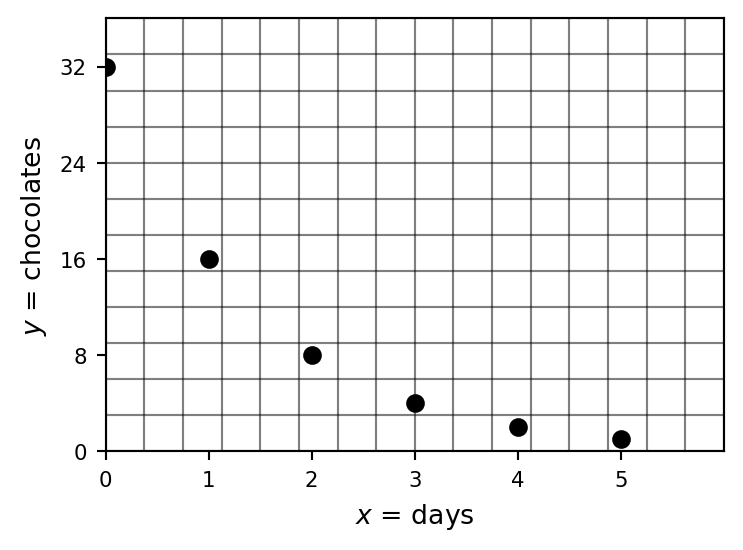
Example 16.1 (Activity: first chocolate scenario) A bowl of chocolates sits on the table in the Stem Learning Center. At the beginning of the week, there are 32 chocolates. Each day Paul takes half of the chocolates that are in the bowl.
Use the variables
- \(x\) is the number of days
- \(y\) is the number of chocolates left in the bowl.
First, make a table of values for this scenario.
Second, use your table of values to construct a plot for this scenario.
Solutions
| \(x\) days | \(y\) chocolates |
|---|---|
| 0 | 32 |
| 1 | 16 |
| 2 | 8 |
| 3 | 4 |
| 4 | 2 |
| 5 | 1 |
The plot shows a curved line. This scenario is not linear.
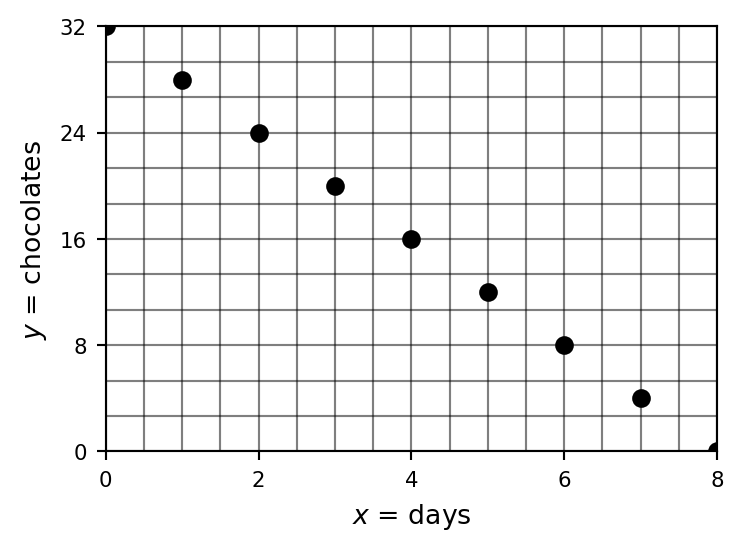
Example 16.2 (Activity: second chocolate scenario) A bowl of chocolates sits on the table in the Stem Learning Center. At the beginning of the week, there are 32 chocolates. Each day Paul takes 4 of the chocolates that are in the bowl.
Use the variables
- \(x\) is the number of days
- \(y\) is the number of chocolates left in the bowl
First, make a table of values for this scenario.
Second, use your table of values to construct a plot for this scenario.
Solutions
| \(x\) days | \(y\) chocolates |
|---|---|
| 0 | 32 |
| 1 | 28 |
| 2 | 24 |
| 3 | 20 |
| 4 | 16 |
| 5 | 12 |
| 6 | 8 |
| 7 | 4 |
| 8 | 0 |
The plot shows a straight line. This scenario is linear.
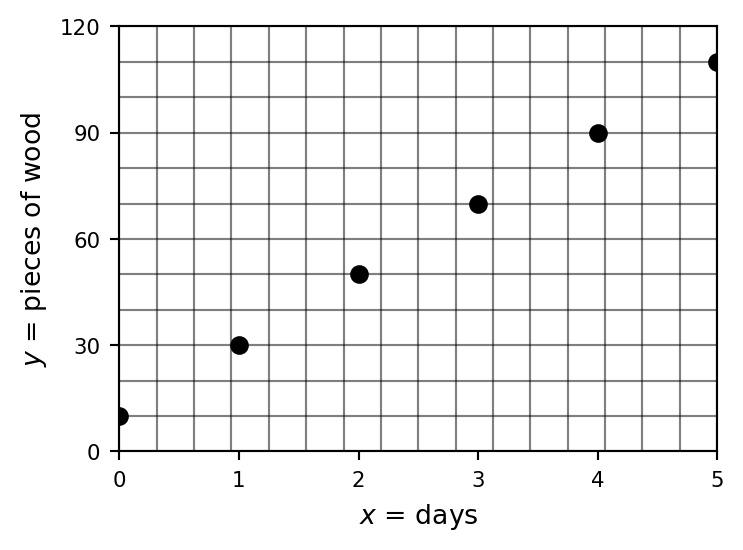
Example 16.3 (Activity: first woodchopping scenario) Pamona is chopping and stacking wood for the winter. At the beginning of the week, there are 10 pieces of wood in her woodpile. Each day she adds 20 pieces of wood to her woodpile.
Use the variables
- \(x\) is the number of days
- \(y\) is the number of pieces of wood in the woodpile
First, make a table of values for this scenario.
Second, use your table of values to construct a plot for this scenario.

Solutions
| \(x\) days | \(y\) pieces of wood |
|---|---|
| 0 | 10 |
| 1 | 30 |
| 2 | 50 |
| 3 | 70 |
| 4 | 90 |
| 5 | 110 |
The plot shows a straight line. This scenario is linear.
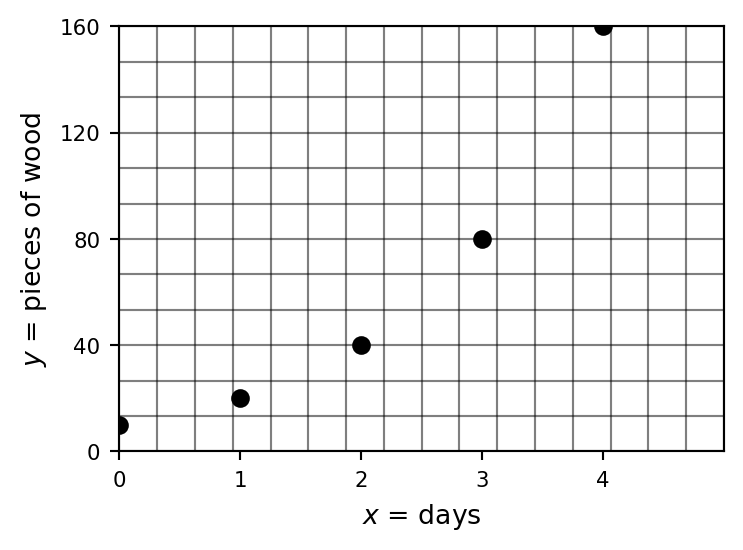
Example 16.4 (Activity: second woodchopping scenario) Pamona is chopping and stacking wood for the winter. At the beginning of the week, there are 10 pieces of wood in her woodpile. Each day she doubles the number of pieces of wood in her woodpile.
Use the variables
- \(x\) is the number of days
- \(y\) is the number of pieces of wood in the woodpile
First, make a table of values for this scenario.
Second, use your table of values to construct a plot for this scenario.

Solutions
| \(x\) days | \(y\) pieces of wood |
|---|---|
| 0 | 10 |
| 1 | 20 |
| 2 | 40 |
| 3 | 80 |
| 4 | 160 |
The plot shows a curved line. This scenario is not linear. (The values grow too rapidly to fit beyond day 4 on the graph paper.)
16.1 Group discussion
Which scenarios have straight line plots? Which did not have straight line plots?
What are the features of scenarios that will have straight line plots?
16.2 Homework exercises
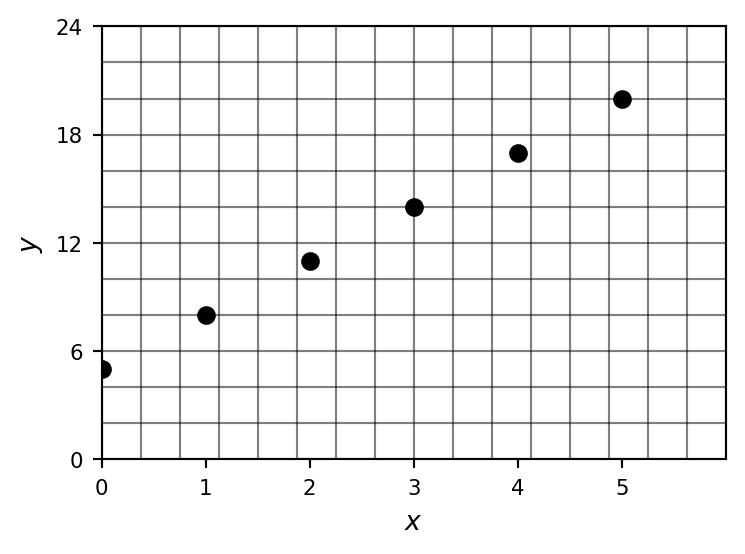
Exercise 16.1 Consider the following table of values. Construct a plot, and then determine whether or not the data is linear.
After you have made the determination, revisit the table. Would it have been possible to deduce that the data is linear by only using the table (and not relying on the plot)?
| x | y |
|---|---|
| 0 | 5 |
| 1 | 8 |
| 2 | 11 |
| 3 | 14 |
| 4 | 17 |
| 5 | 20 |

Solutions
The data is linear. The \(y\) values increase by 3 for each increase of 1 in \(x\). This is a constant rate of change. You can verify this from the table alone without plotting.
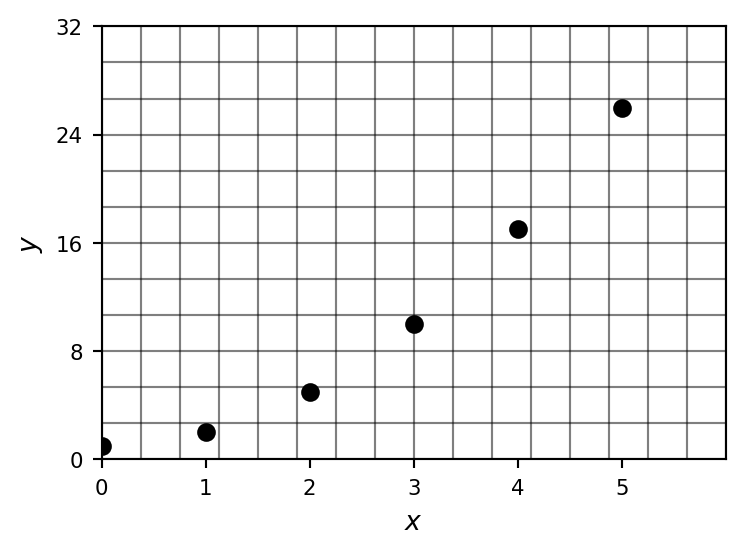
Exercise 16.2 Consider the following table of values. Construct a plot, and then determine whether or not the data is linear.
After you have made the determination, revisit the table. Would it have been possible to deduce that the data is linear by only using the table (and not relying on the plot)?
| x | y |
|---|---|
| 0 | 1 |
| 1 | 2 |
| 2 | 5 |
| 3 | 10 |
| 4 | 17 |
| 5 | 26 |

Solutions
The data is not linear. The \(y\) values increase by 1, 3, 5, 7, 9. The differences are not constant, so the plot will be a curve. You can spot this from the table alone.
Exercise 16.3 The following is a list of scenarios. Try to determine, without plotting, whether the scenario will be linear or not.
Father Mike lights a candle at the church. Originally, the candle is 10 inches tall. Each hour, the candle burns away 1/2 inch of height. Does the height of the candle change linearly?
Mayor Dan is serving pancakes at the Plaza. He starts with a supply of 400 pancakes. During the first hour, half of the pancakes are eaten. During the second hour, half of the remaining pancakes are eaten. Does the number of remaining pancakes change linearly?
Colin is making a collection of wooden boxes to hold telescope lenses. The boxes are square, but with different widths. Does the area of the box change linearly when the width is changed?
Colin is making a collection of wooden boxes to hold telescope lenses. The boxes are square, but with different widths. Does the perimeter of the box change linearly when the width is changed?
Solutions
Yes, linear. The candle loses \(\frac{1}{2}\) inch every hour. This is a constant rate of change.
No, not linear. Each hour the remaining pancakes are multiplied by \(\frac{1}{2}\), just like the first chocolate scenario. This gives a curved plot.
No, not linear. The area equals width², which grows faster and faster as the width increases.
Yes, linear. The perimeter equals \(4 \cdot \text{width}\), so the perimeter increases by 4 for every 1-unit increase in width. This is a constant rate of change.
Exercise 16.4 Construct two tables of values as follows:
- Construct a data table where the plot will be linear. The table needs to have five rows in it.
- Construct a data table where the plot will not be linear. The table needs to have five rows in it.
After you have constructed your tables, make plots for each.
Exercise 16.5 Construct two scenarios as follows:
- Construct a scenario where the corresponding data plot will be linear. Make both a data table and a plot for your scenario.
- Construct a scenario where the corresponding data plot will not be linear. Make both a data table and a plot for your scenario.